A system that sees itself.
A German lighting manufacturer's entire retrofit operation, from first inquiry to dispatch, built so it can show where the work really is. Client anonymized.
The problem
The operation was real and growing, but invisible as a process. Work lived across email, spreadsheets and people's heads. Nobody could say where a given job was stuck, how long a job truly took, or how often work got redone.
The instinct, and why it is not enough
The obvious build is a status tracker: a board that shows where each job is. But a tracker tells you where each job is. It cannot tell you where the process stalls, how long a stage really takes, or how often work is redone. You cannot improve what you only track.
The design: run it, and mine it
I built the full lifecycle, five roles and nineteen stages, from inquiry through lab measurement, retrofit, article-code and document generation, to dispatch. And from the first version it carries an event log and a process-mining layer. Every stage transition is captured as a by-product of running the operation, and that log is the raw material the mining reads.
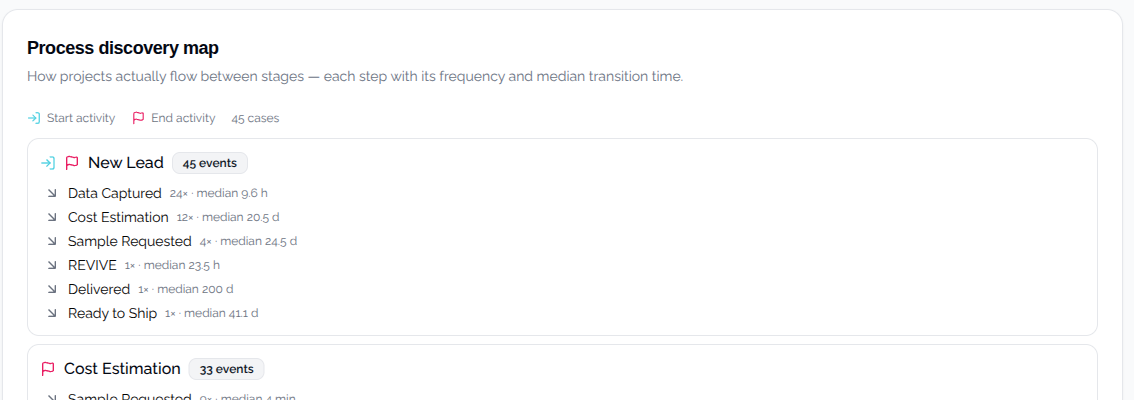
What it shows
Because the operation is instrumented, it reports on itself: where projects jam, how long a job really takes, how often work is redone, and how closely reality follows the intended process.
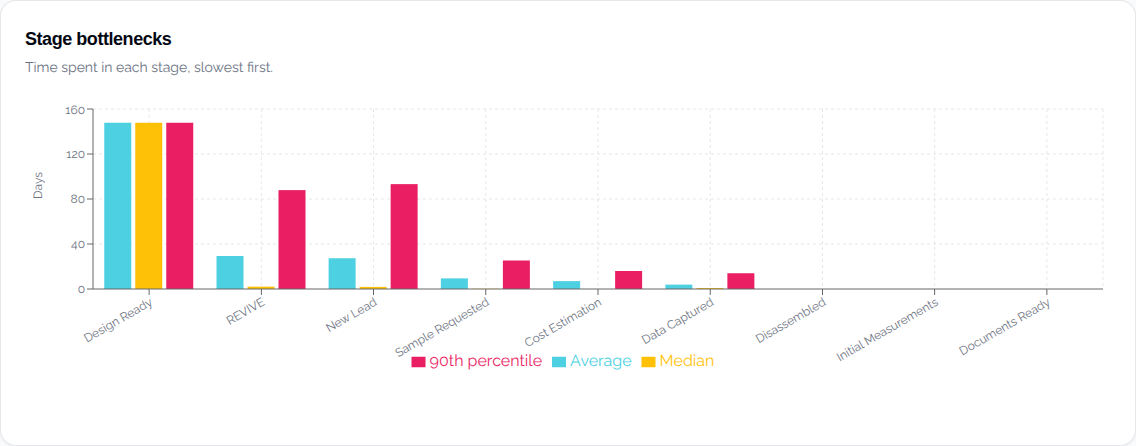
Most teams add analytics years later, after the data to measure the past is already gone. I built the event log and the mining layer into the first version. That is why a young system can already show its own bottlenecks. Measurement is a design decision, made at the start.
You can't improve what you never counted. The system is young, so today it shows the current state honestly and points at the next fix. An operation you can see is an operation you can improve.
Honest scope: this system is live in production and carries real customer data across 45 projects. The numbers above are from its own event log. It is a young system, and it is presented as one, current state and next fix, not a finished story.
Have an operation you can't see through?
Bring the decision to a paid session and receive an external assessment with a written recommendation.
View the decision session →Watch the companion video and read the workflow notes →
Next: a bid desk that shows its work →